There are times your SEO results will look like the opposite of what you’re after.
Average Position is a bit of a weird metric. Here’s why.

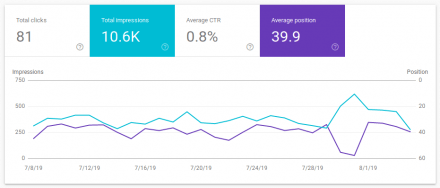
Consider that graph for a moment. Taken directly from Google Search Console (Google’s official stats package for organic search – and my recommendation for the tool you should use to get your ranking and other organic search results) they show two highlighted metrics;
- Total impressions (in teal) and
- Average position (in purple).
Impressions is the number of times a site was seen in search results. Average position is the average rank it was seen in.
(Google averages your rank across all impressions as a useful workaround to their personalisation they do when people are searching. Location, how often a user has searched for something before – there are myriad ways Google skews results. Averaging them out is the best approach to find the most useful ranking to report.)
If you look at the lines on the graph though you’ll see a number of places where the position appears to get worse right when the impressions become more successful. You’d think stats should improve hand-in-hand, not get worse as one improves. Right?
In reality, when impressions spikes it’s normal for the average position to drop. If a site suddenly has a lot more visibility, it usually means it’s being found for a bunch of terms and searches it wasn’t previously. A lot of those new terms are likely to be things sort of around the periphery of what the site is about, not just it’s core purpose. So it’s being found for a bunch of extra search terms.
The result of that is those new terms probably aren’t ranking terribly highly. They’re not the site’s main purpose, so won’t be ranking as highly as the normal terms the site has been successful for.
Which drags the average rank DOWN.
Not only is this good to know when interpreting your own results, but it serves as a reminder that stats aren’t simply the end of the story, it’s important to understand how they come about, and what their effect on each other is.